

Sales and R&D
PureDefinition SA Tool
Introduction
The PureDefinition™ Signal Analysis Tool is a software tool used to acquire and present measurement results from remote signal measurement probes or laboratory test setups. It allows signal evaluation and long term monitoring of signal quality at any particular site over IP based networks. Alternatively, the PureDefinition™ Signal Analysis Tool installed on a laptop computer can be connected directly to a measurement receiver for laboratory testing and transmitter performance evaluation.
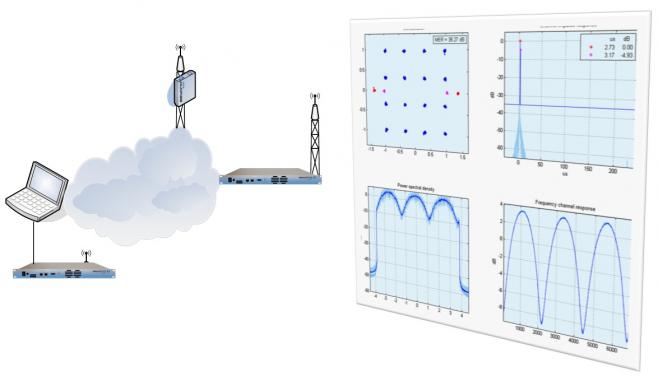
The PureDefinition™ Signal Analysis Tool presents numerous standard and custom defined signal quality parameters and measurement quantities such as constellation diagram, modulation error ratio, bit error rate, power spectral density, channel impulse response, signal power and others. It extends the measurement capabilities of DVB measurement probes and presents results in user-friendly graphical or numeric form.
Due to the real-time capability of measurement probes it can record data without missing a single event or enter an event log based on a configured signal quality conditions (e.g. MER threshold).
The PureDefinition™ Signal Analysis Tool is especially suited for operators, government agencies and other professional users who require constant signal quality monitoring and accurate signal analysis without the cost of general purpose signal analysers.
Key Benefits
- Access to remote field based measurement probes or desktop measurement receiver
- Laboratory grade measurement results
- Real-time operation
- Management and data streaming over IP networks
- On-site free integration support
Key Performance Characteristics
- Minimum signal power as low as -98 dBm
- Measured MER up to 44 dB
- C/N as low as 3.5 dB
Key features:
- PC based, easy to use software tool
- Fully compliant with ETSI EN 300 744 standard
- Numerous signal quantity measurements
- Complex path delay profile analysis
- Rack and wall-mount housing available
- Graphical presentation of measured results in a user-friendly form